OVERVIEW
Transforming Metrics into Meaningful Insights
During my internship as a UI/UX Designer with RMIT University and Regen Melbourne, I contributed to the Greater Melbourne City Portrait project, which utilized the Doughnut Economics framework to visualize sustainability metrics. The project sought to align ecological sustainability with social equity, providing stakeholders with actionable insights for informed decision-making. My role involved creating intuitive interfaces, refining data visualizations, and ensuring that complex metrics were accessible to policymakers, researchers, and the community.
PROBLEM
Redesigning Clarity: Enhancing Melbourne’s Doughnut
The Greater Melbourne City Portrait project aimed to provide actionable insights into Melbourne’s sustainability progress through the Doughnut Economics framework. My role focused on integrating the Four Lenses framework, designing a time-series visualization for new data, and redesigning the widget interface to improve clarity, usability, and alignment with sustainability goals.

PROCESS

Researches
Research centered on understanding the Doughnut Economics framework and its importance of reaching the safe zone. By analyzing stakeholder roles, such as policymakers and government officials, I identified the need for clear, accessible visualizations to support decision-making and align with the framework’s principles.


SOLUTION
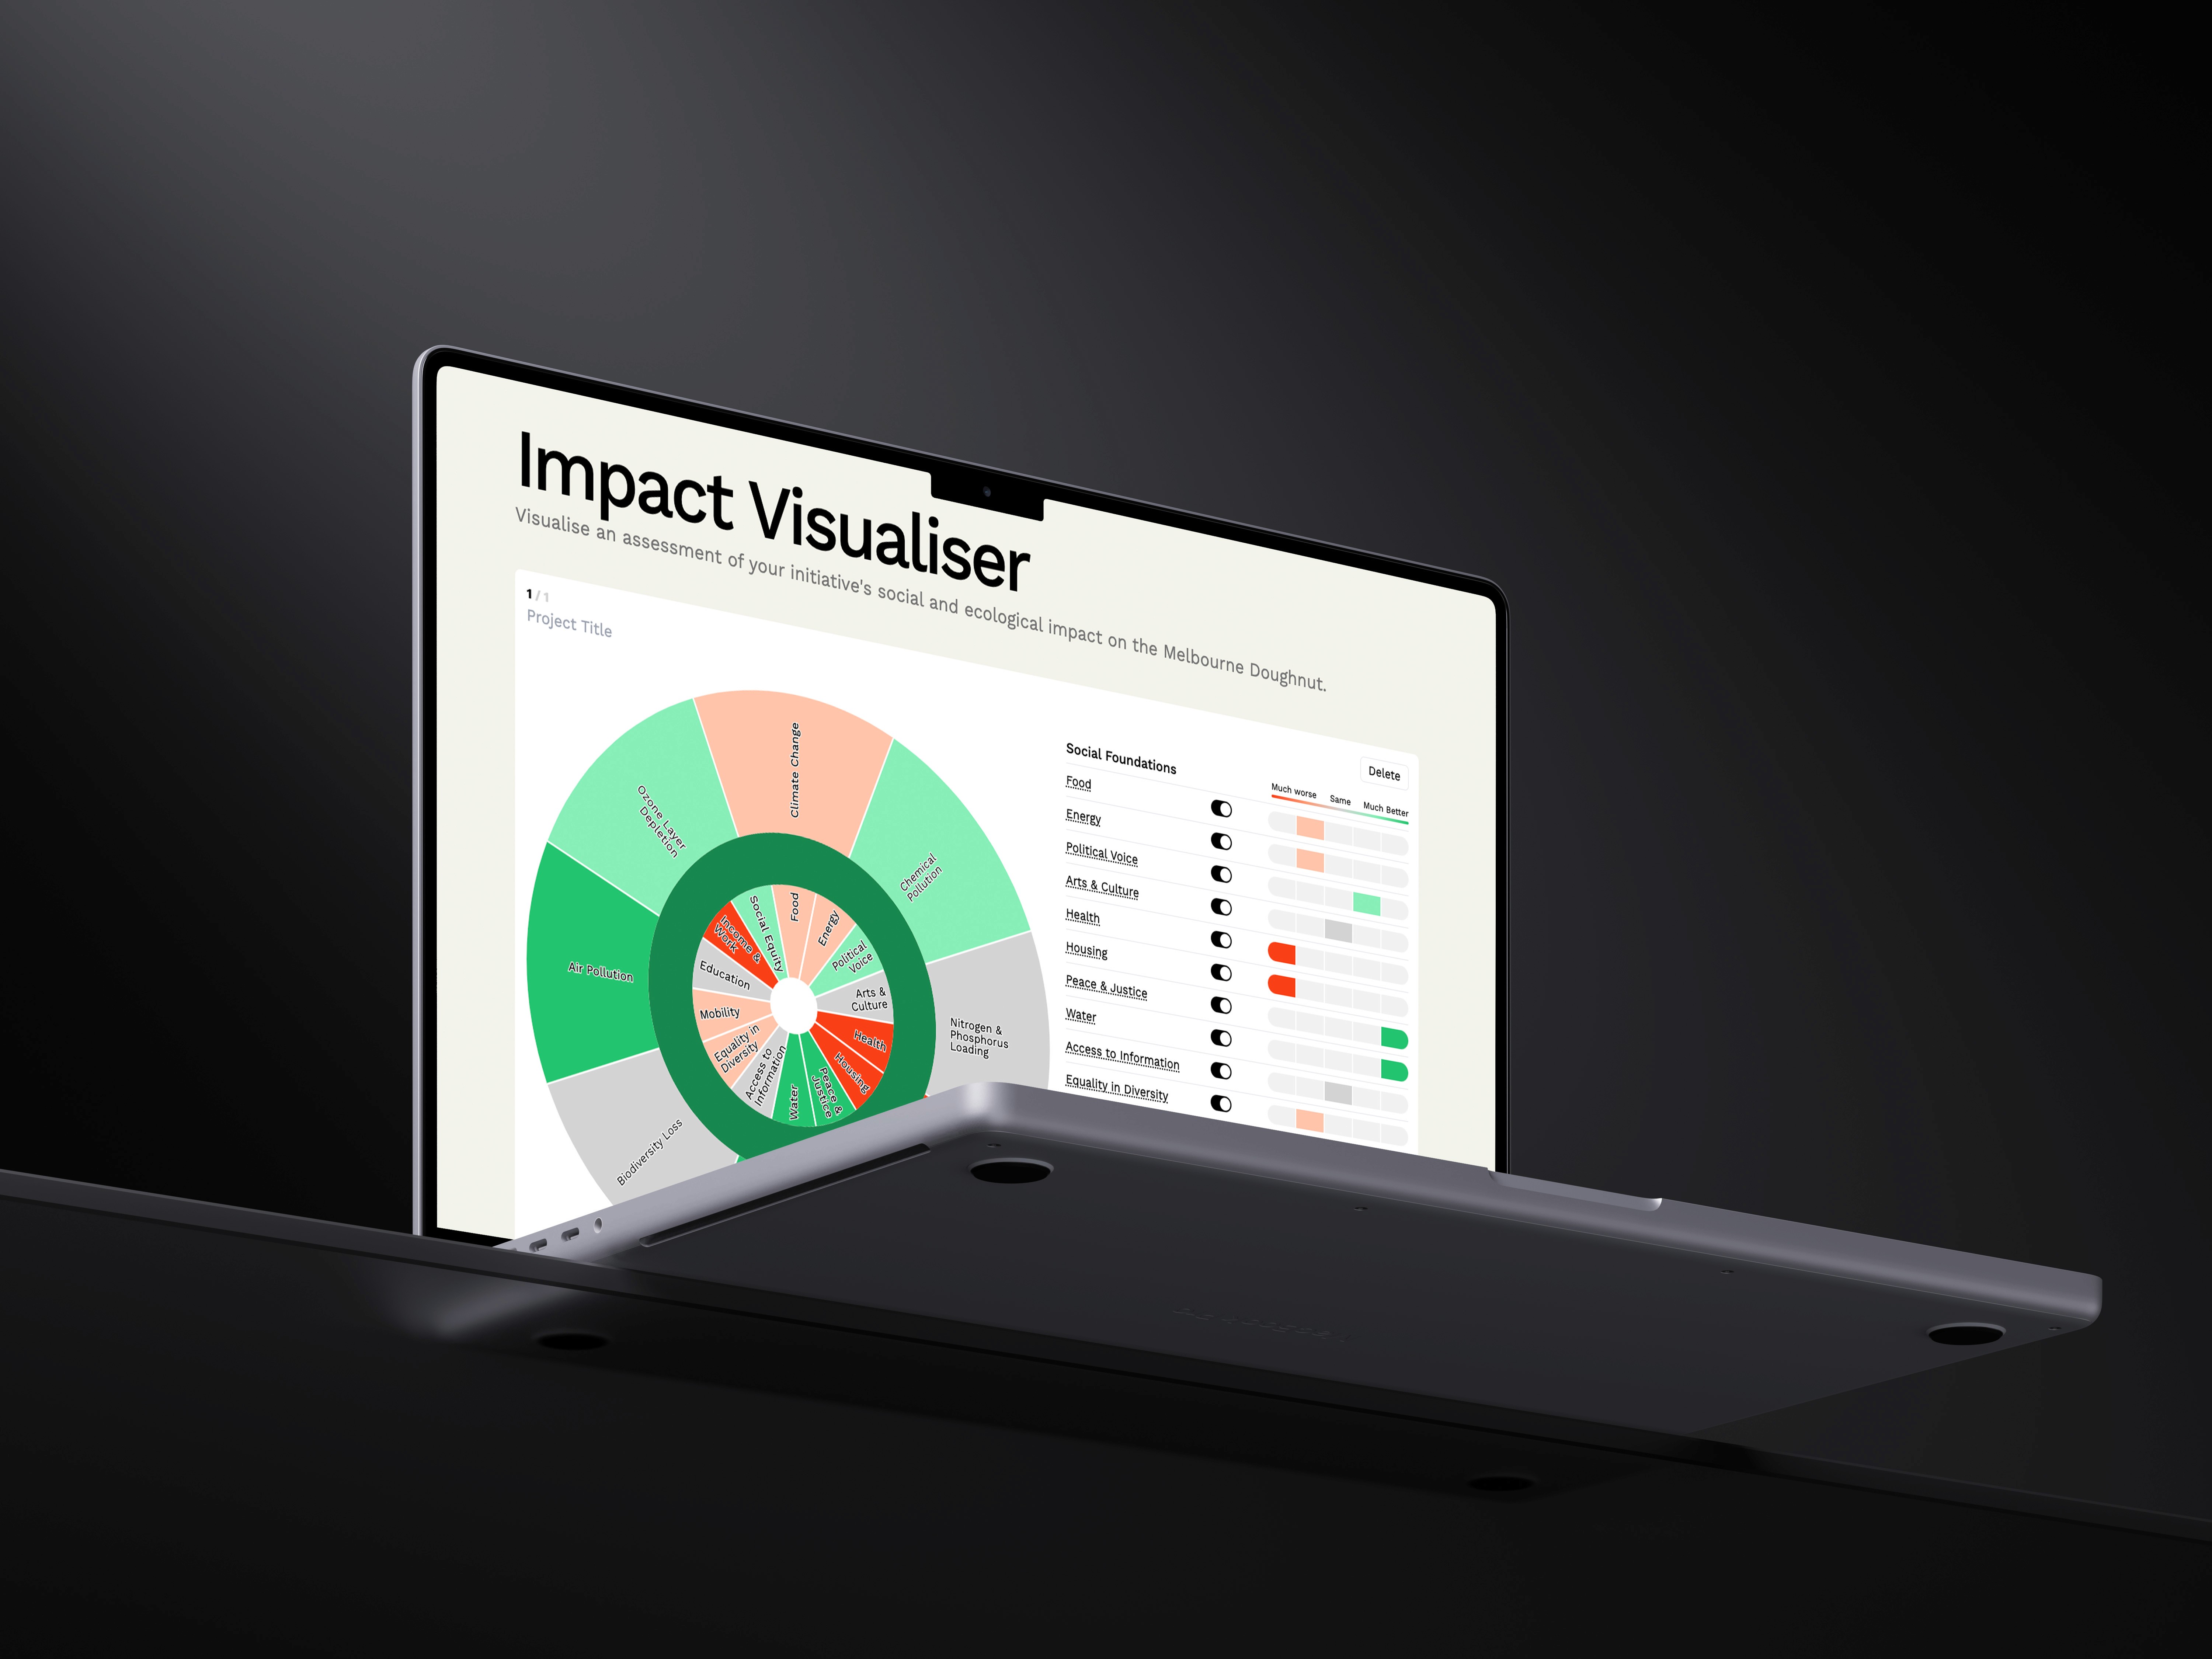
Redesigned Widget Interface First Iteration
Replaced the original arrow indicators with color-coded bars to signify worsening (red) or improving (green) conditions. Adjusted the bar thickness to represent the magnitude of change, enhancing clarity for users.

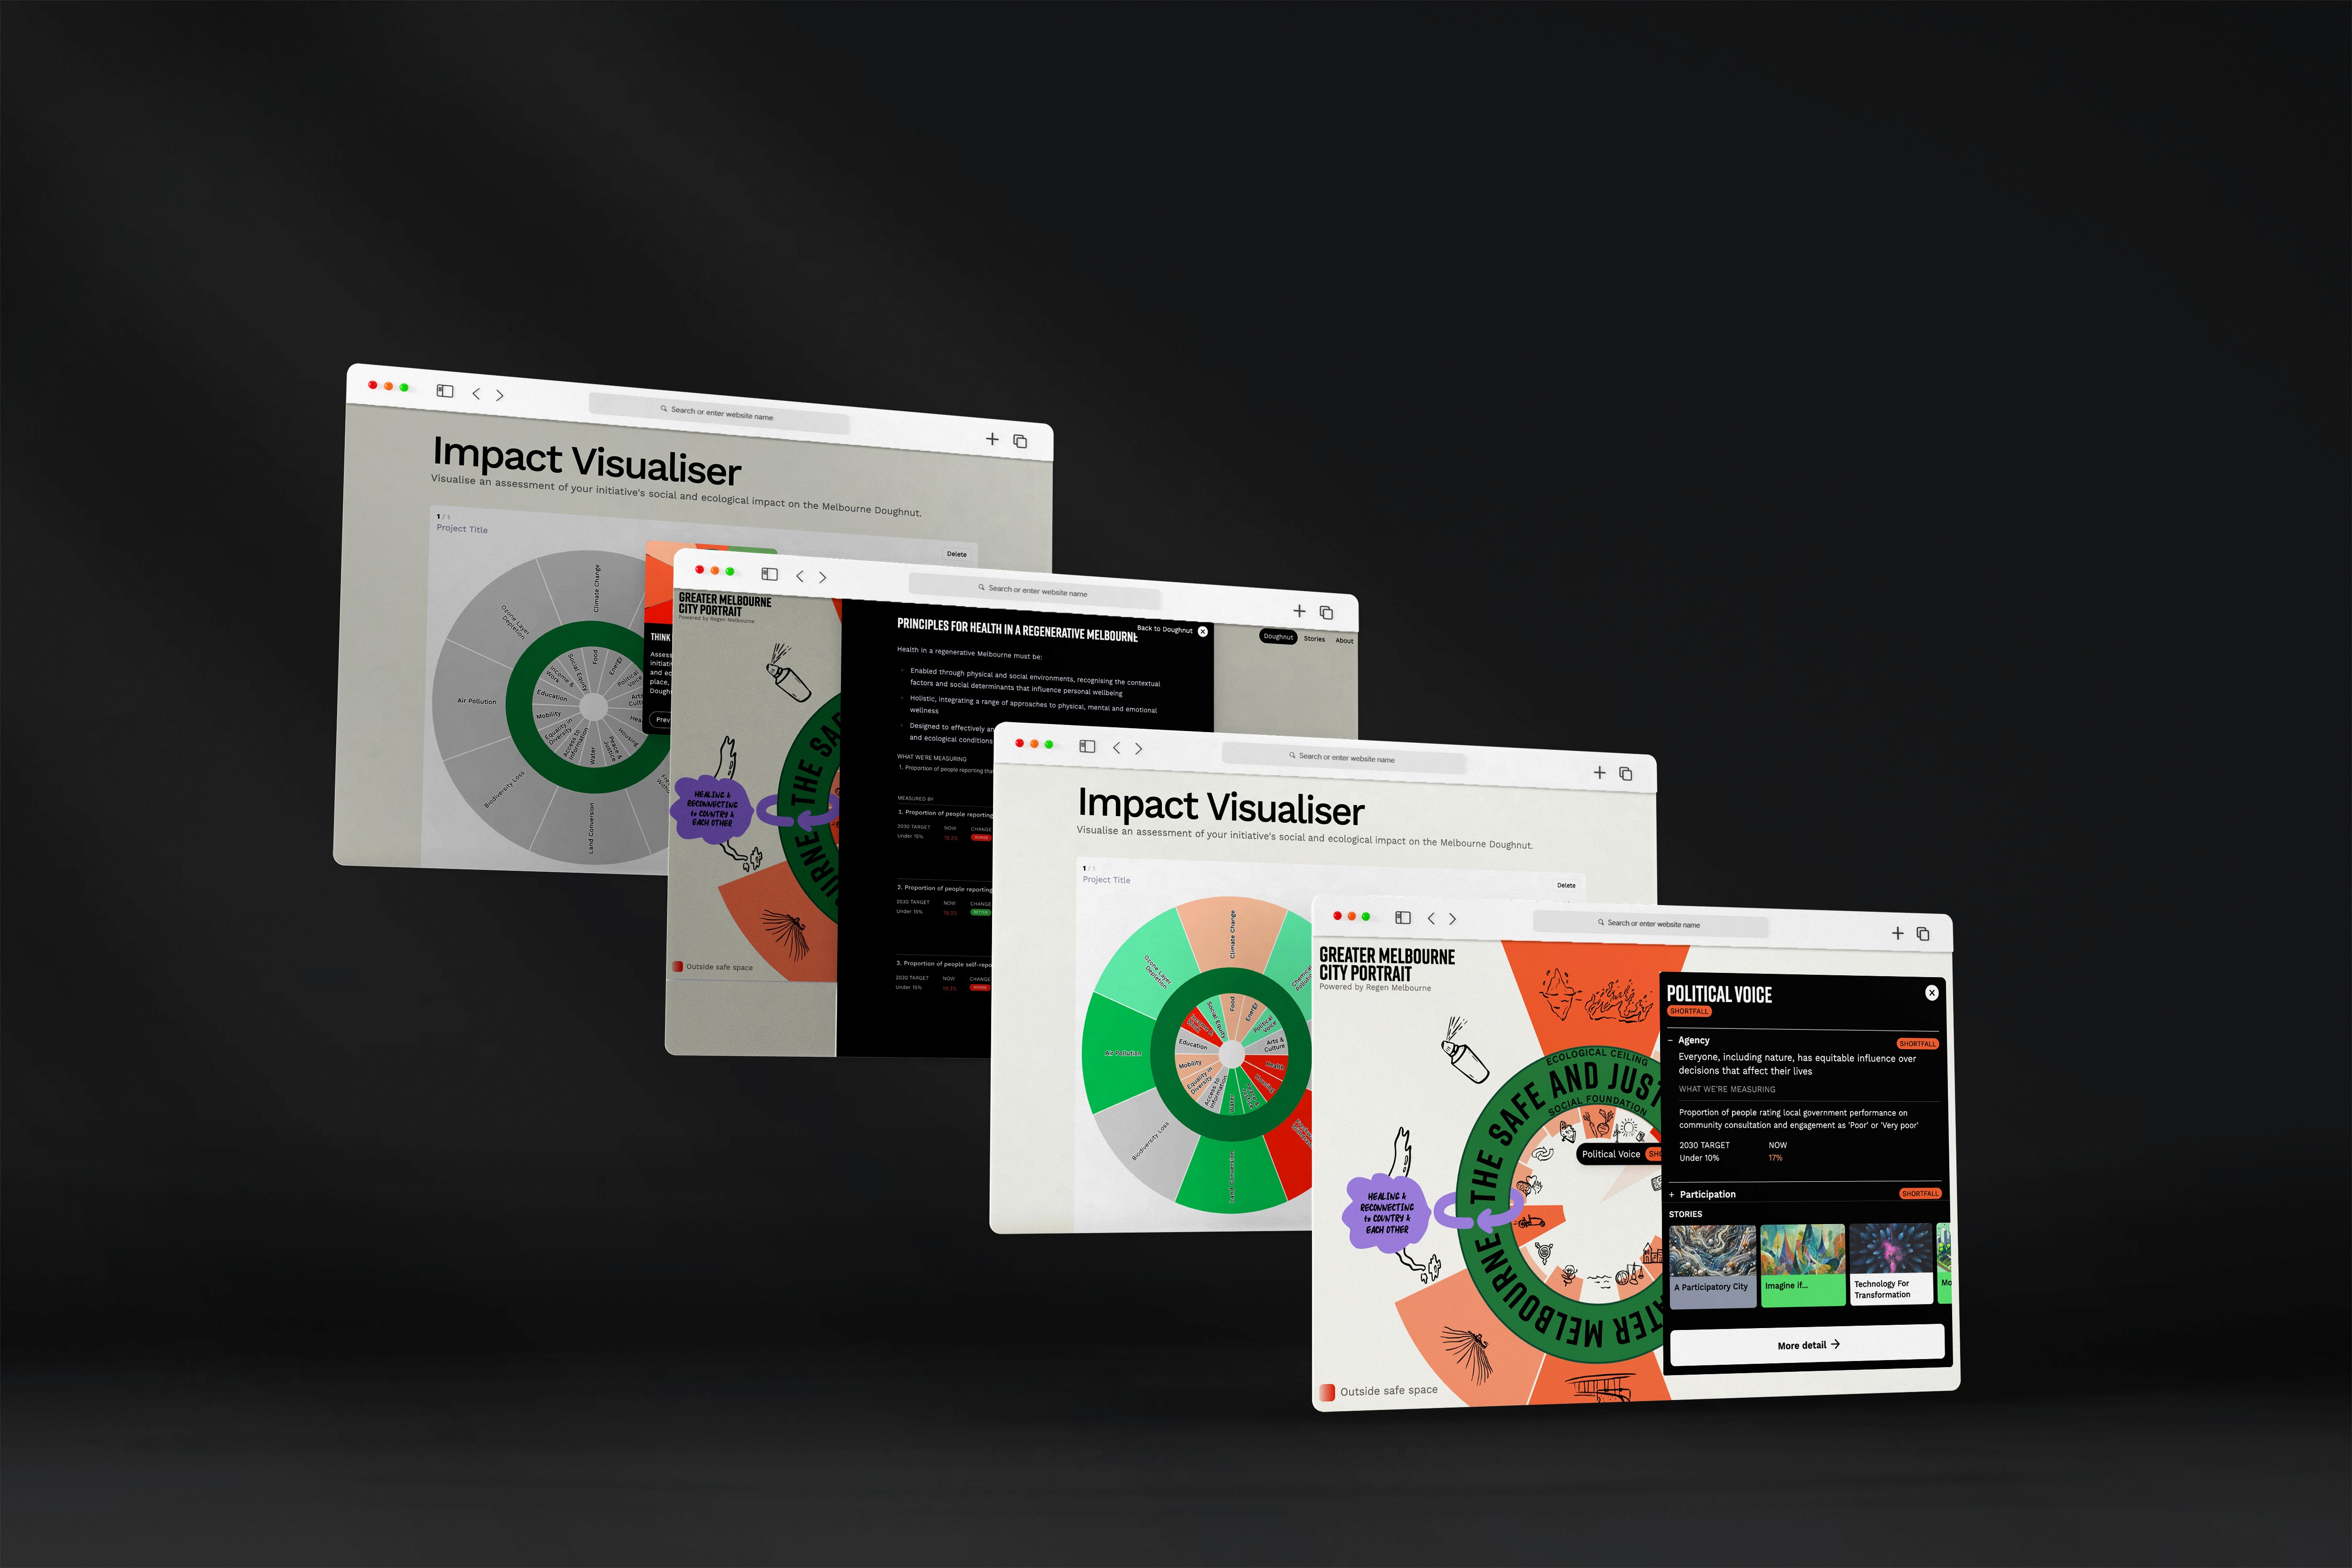
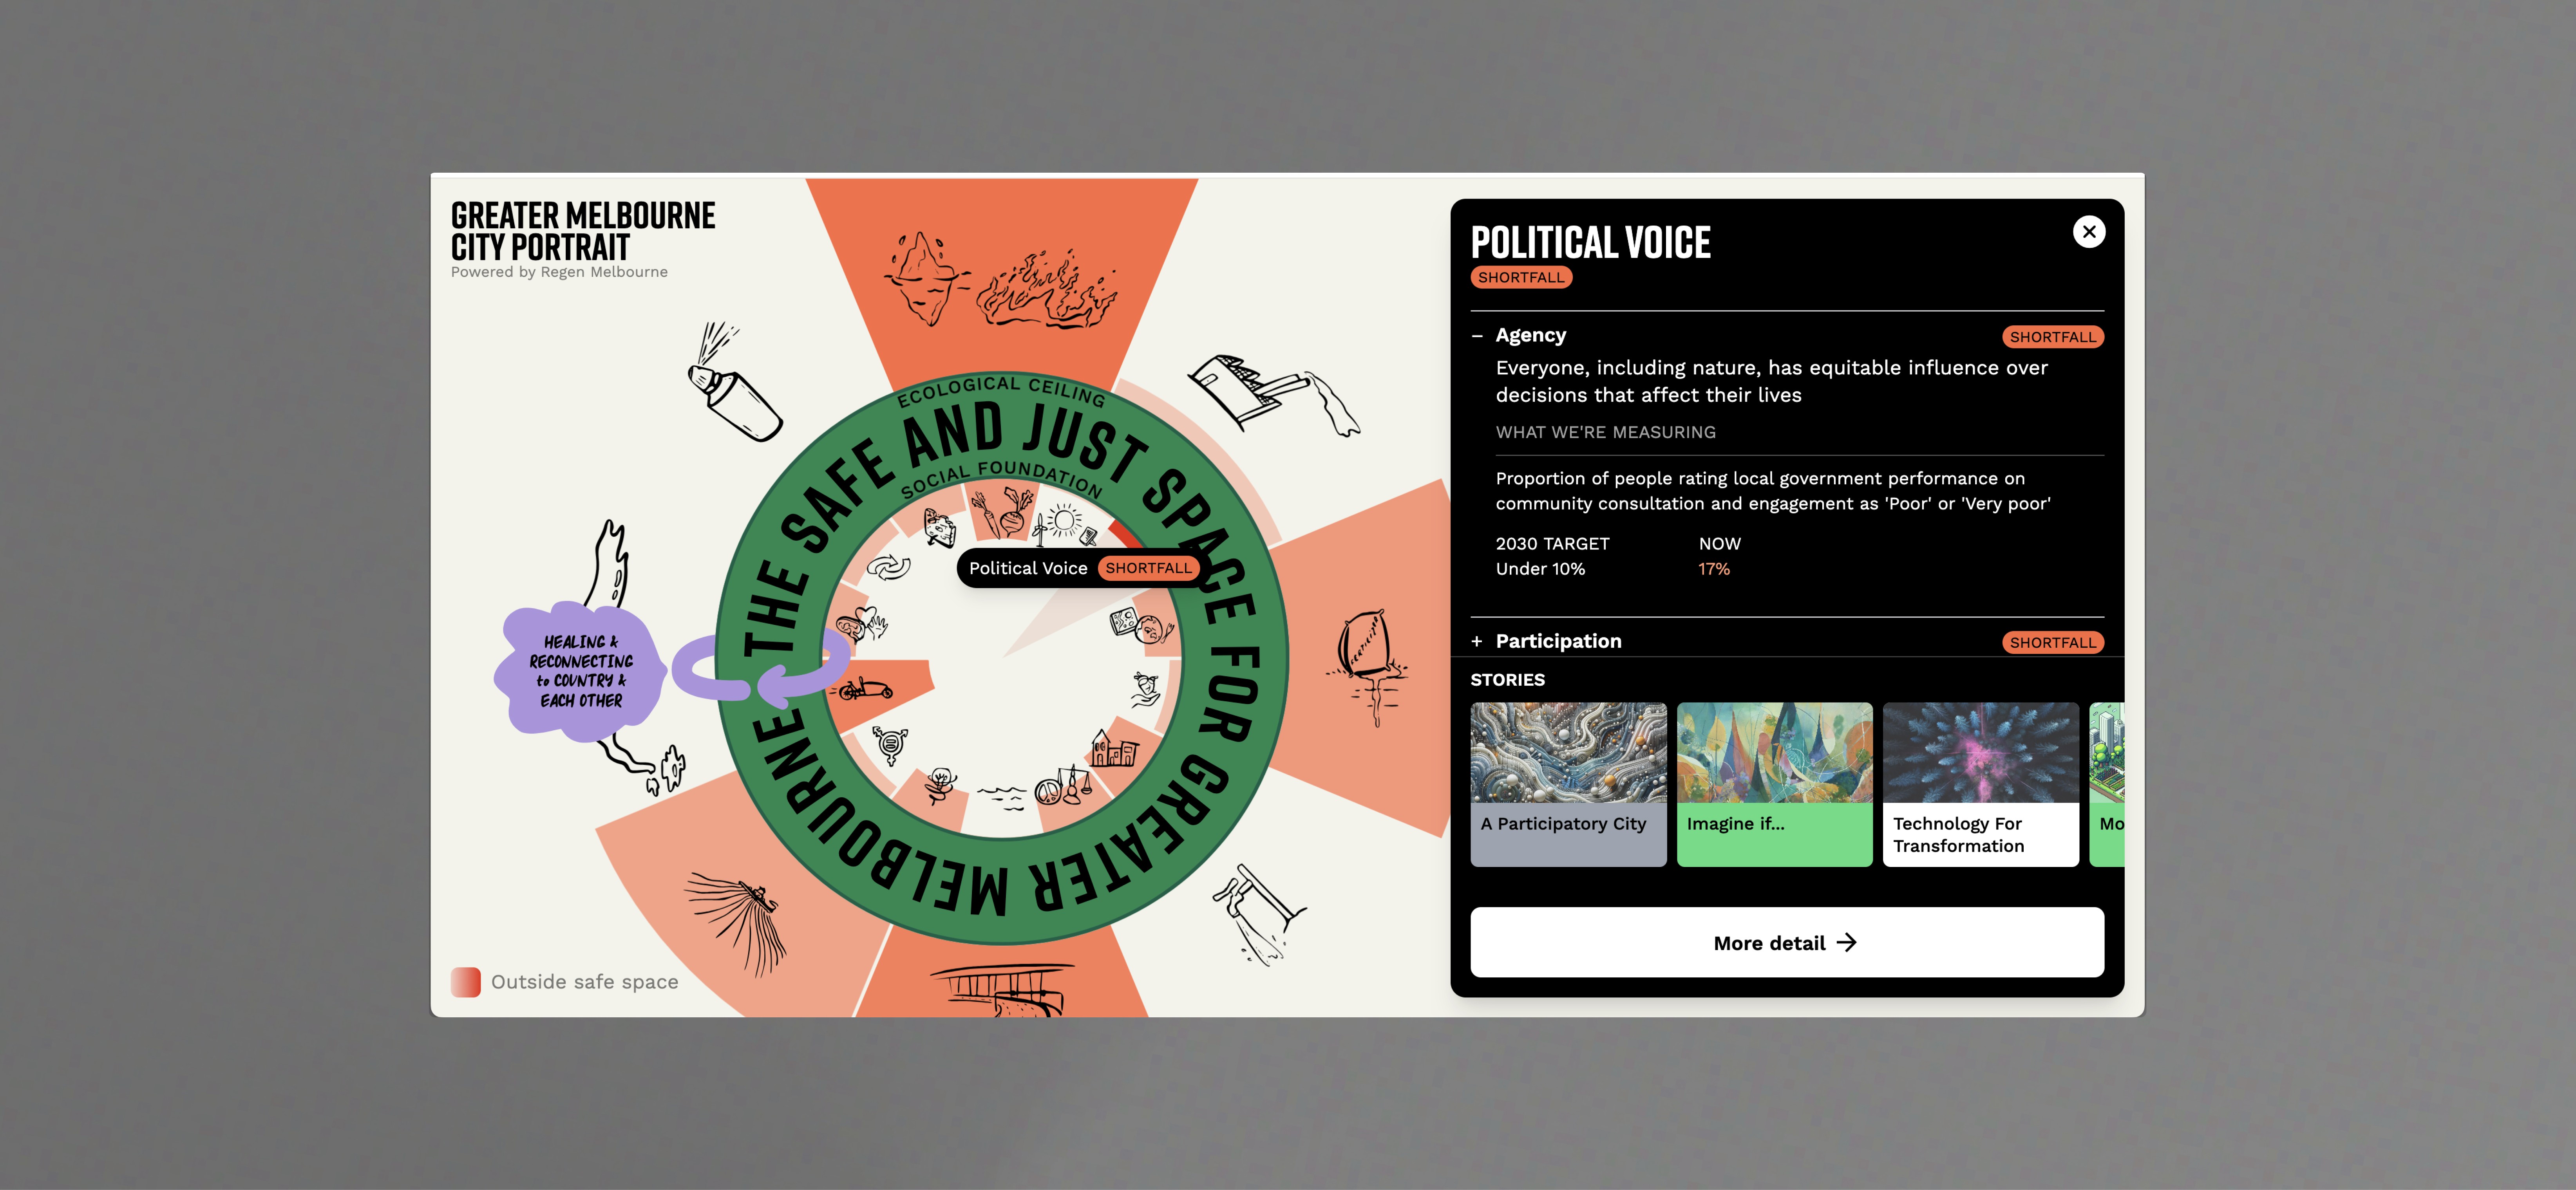
Redesigned Widget Interface Second Iteration
Incorporated interactive tooltips that provide brief explanations of each indicator, reducing the cognitive load for users unfamiliar with the metrics. Introduced toggle buttons to replace checkboxes, creating a more intuitive selection process and simplifying navigation between indicators. Added a hover state to highlight selected items, making interactions more seamless and visually engaging.
Time-Series Visualization
Designed dynamic hover states to present detailed data without overwhelming the interface. Refined layout spacing with optimized padding and margins to improve readability and usability. Replaced confusing arrow-based status indicators with clear “better” and “worse” labels, using color to enhance immediate comprehension.

Four Lenses Framework
The Four Lenses framework—designed to integrate local/global and social/ecological factors—remains a work in progress due to the complexities of balancing clarity, usability, and interconnected data representation. While the current deliverables are not final, they provide a foundational starting point for future iterations. Through this process, I learned the importance of iterative design and user feedback in tackling complex visualizations. Each draft and test brought new insights, emphasizing the need to simplify relationships between metrics without losing the theoretical integrity of the Doughnut Economics framework. These deliverables highlight the potential for future development, offering direction and initial concepts for creating an intuitive and impactful visualization tool.
How the solution making a difference?
Accessible
Insights with Simplified navigation and visuals empowered users to interpret complex data with ease.
Improved
Decision-Making: Intuitive layouts and interactive elements supported informed decisions, enhancing user engagement by 30%.
Cohesive
Visual Language: Standardized designs reinforced professionalism and aligned with the framework.
REFLECTION

Reflection: Pushing Boundaries for the Future
This project was a great learning experience, teaching me the importance of iterative testing and user-centered design in making complex frameworks accessible. While I’m proud of the impact the platform achieved, deeper user testing and exploring more customizable visualizations could further enhance its effectiveness. This experience reinforced my commitment to creating tools that simplify complexity and empower informed decision-making.